 Talli
Dashboard and reports
Know how your events are going.
The event day dashboard shows who has arrived while the doors are open. The Overview shows the whole organization at a glance, and Reports answer how your events performed over any period, with exports for the spreadsheet.
What gets in the way of knowing how events went
Common reporting problems for event teams, and what Talli does about each one.
Nobody sees every event at once
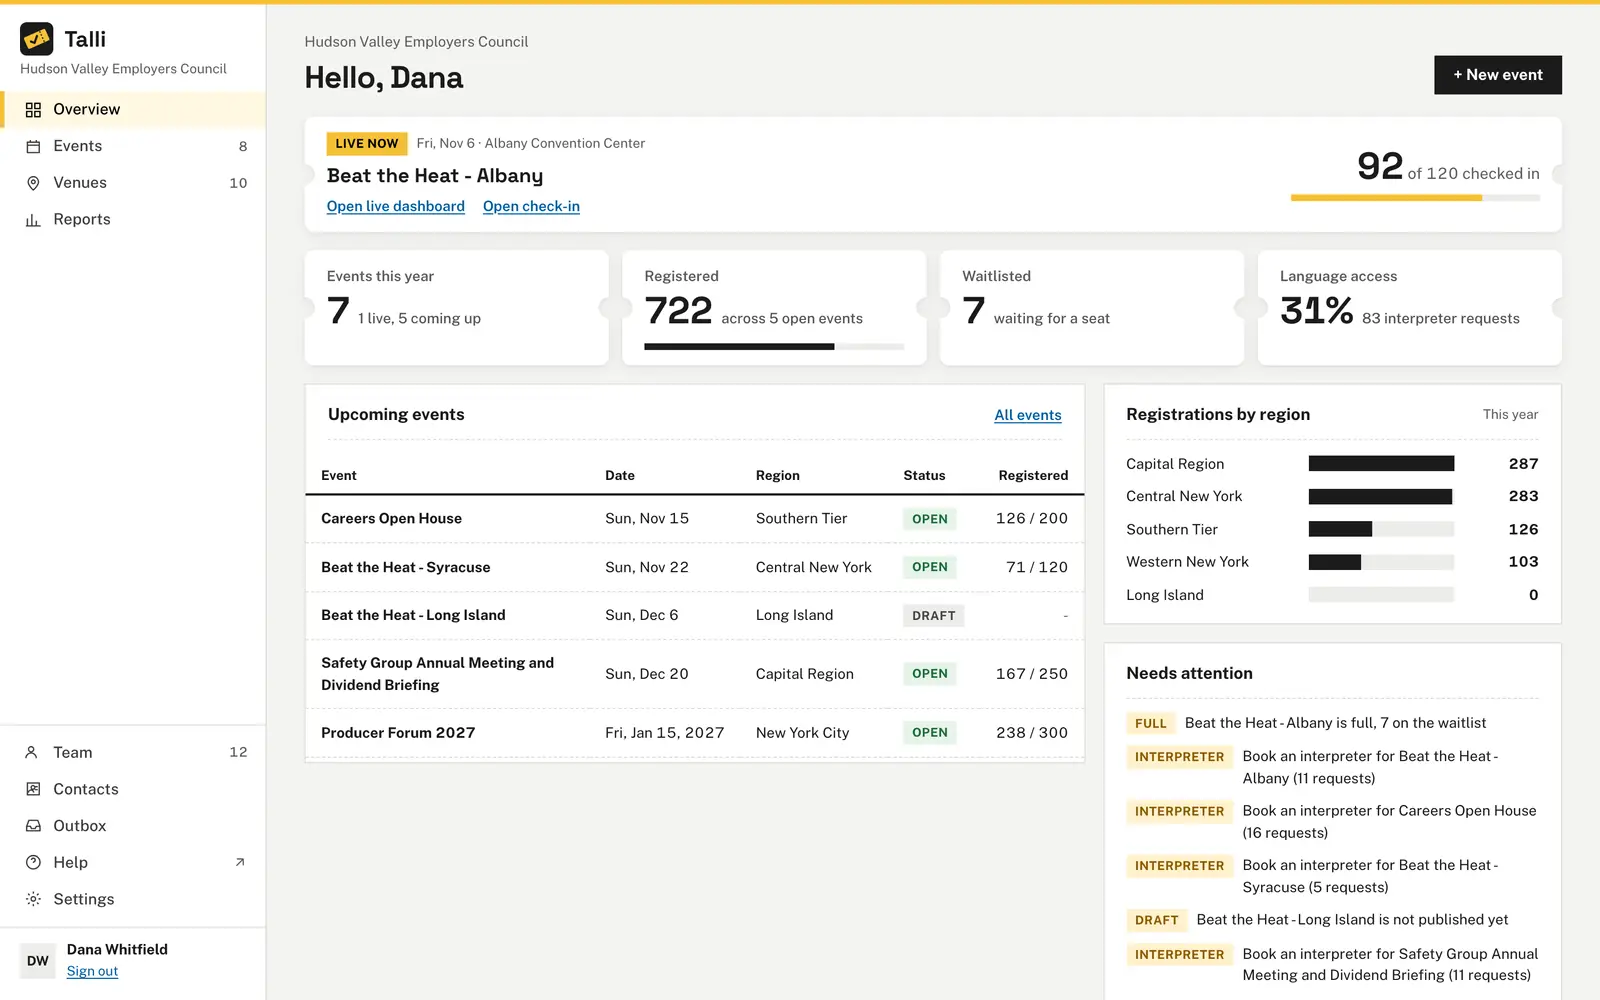
Overview shows a Live now card for each running event, this year's events, registrations against seats, the waitlist and language access. Needs attention flags full events with a waitlist, drafts and interpreter requests.
Year-end numbers take weeks to pull together
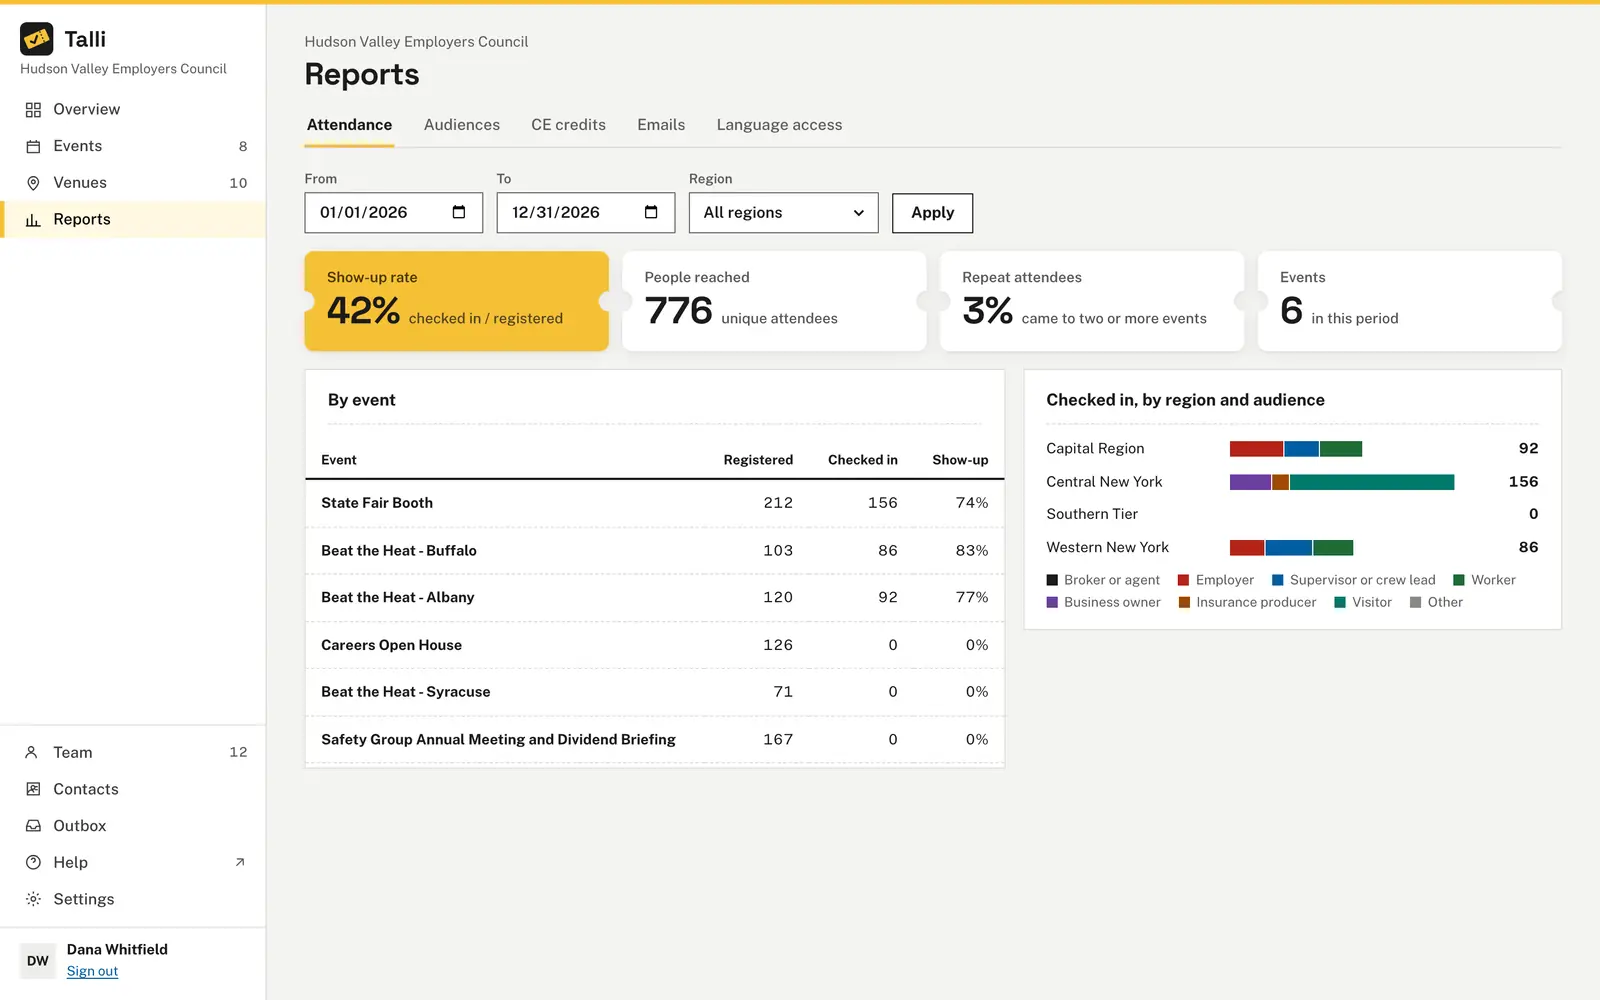
Choose a date range and region, then read the Attendance, Audiences, CE credits, Emails and Language access tabs. Attendance gives the show-up rate, people reached, repeat attendees and results by event.
Credits have to be tallied by hand
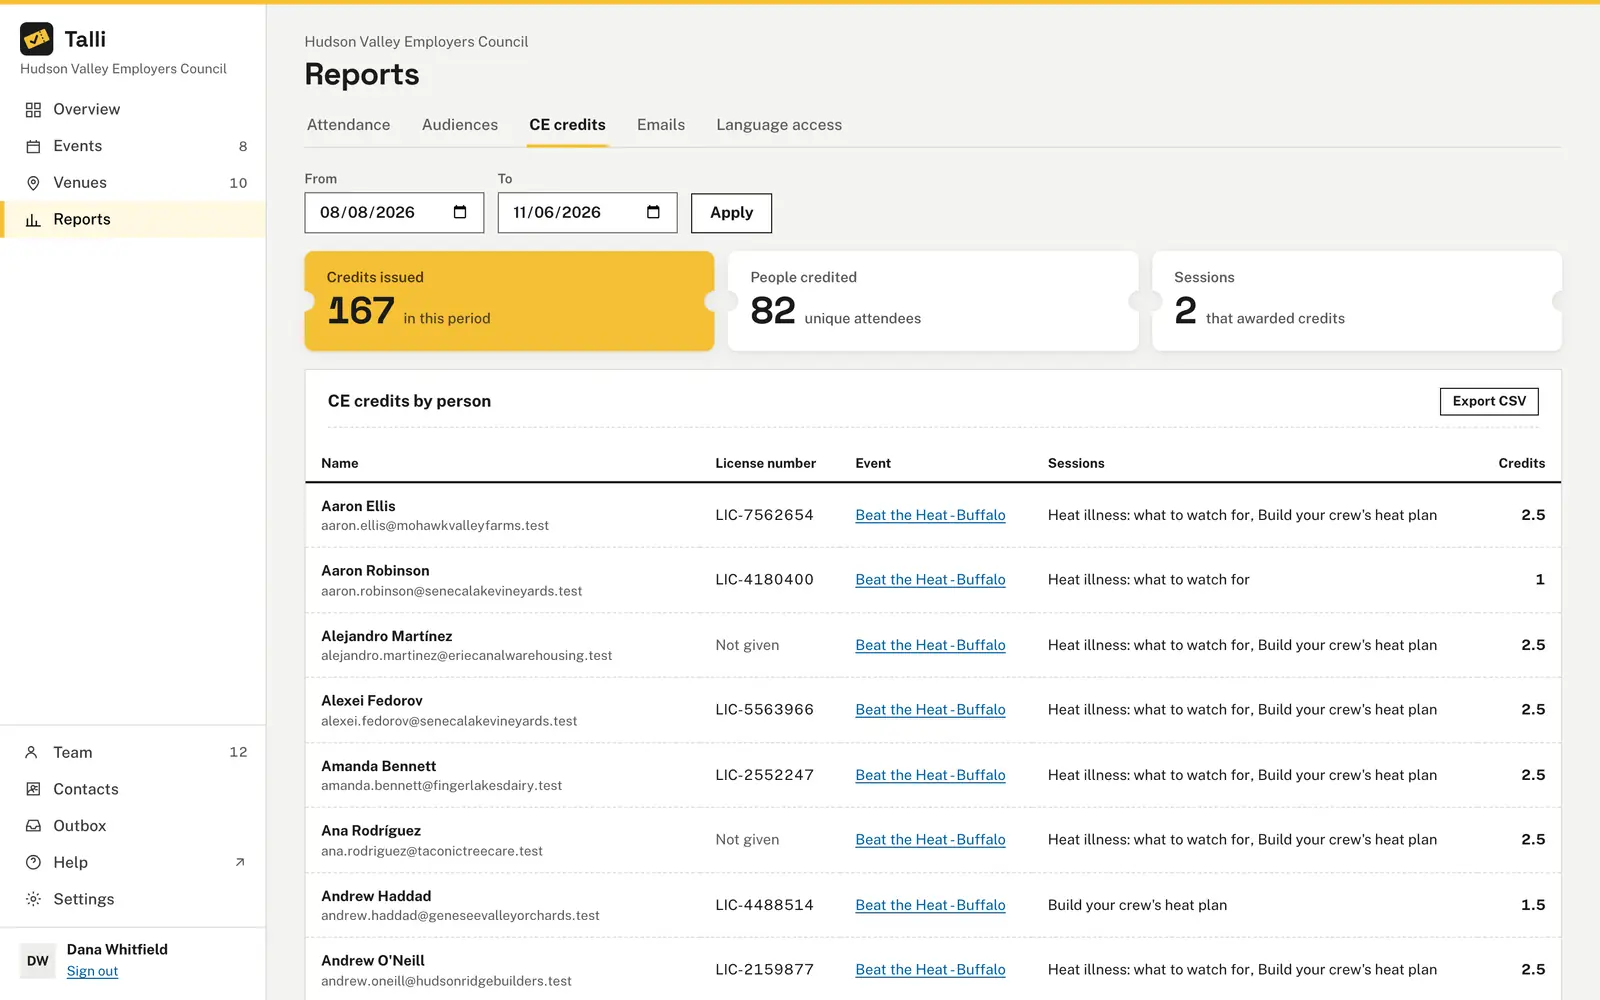
The CE credits report lists each person's license number, event, sessions and credits, and owners and admins can download it with Export CSV.
Event day is a blur
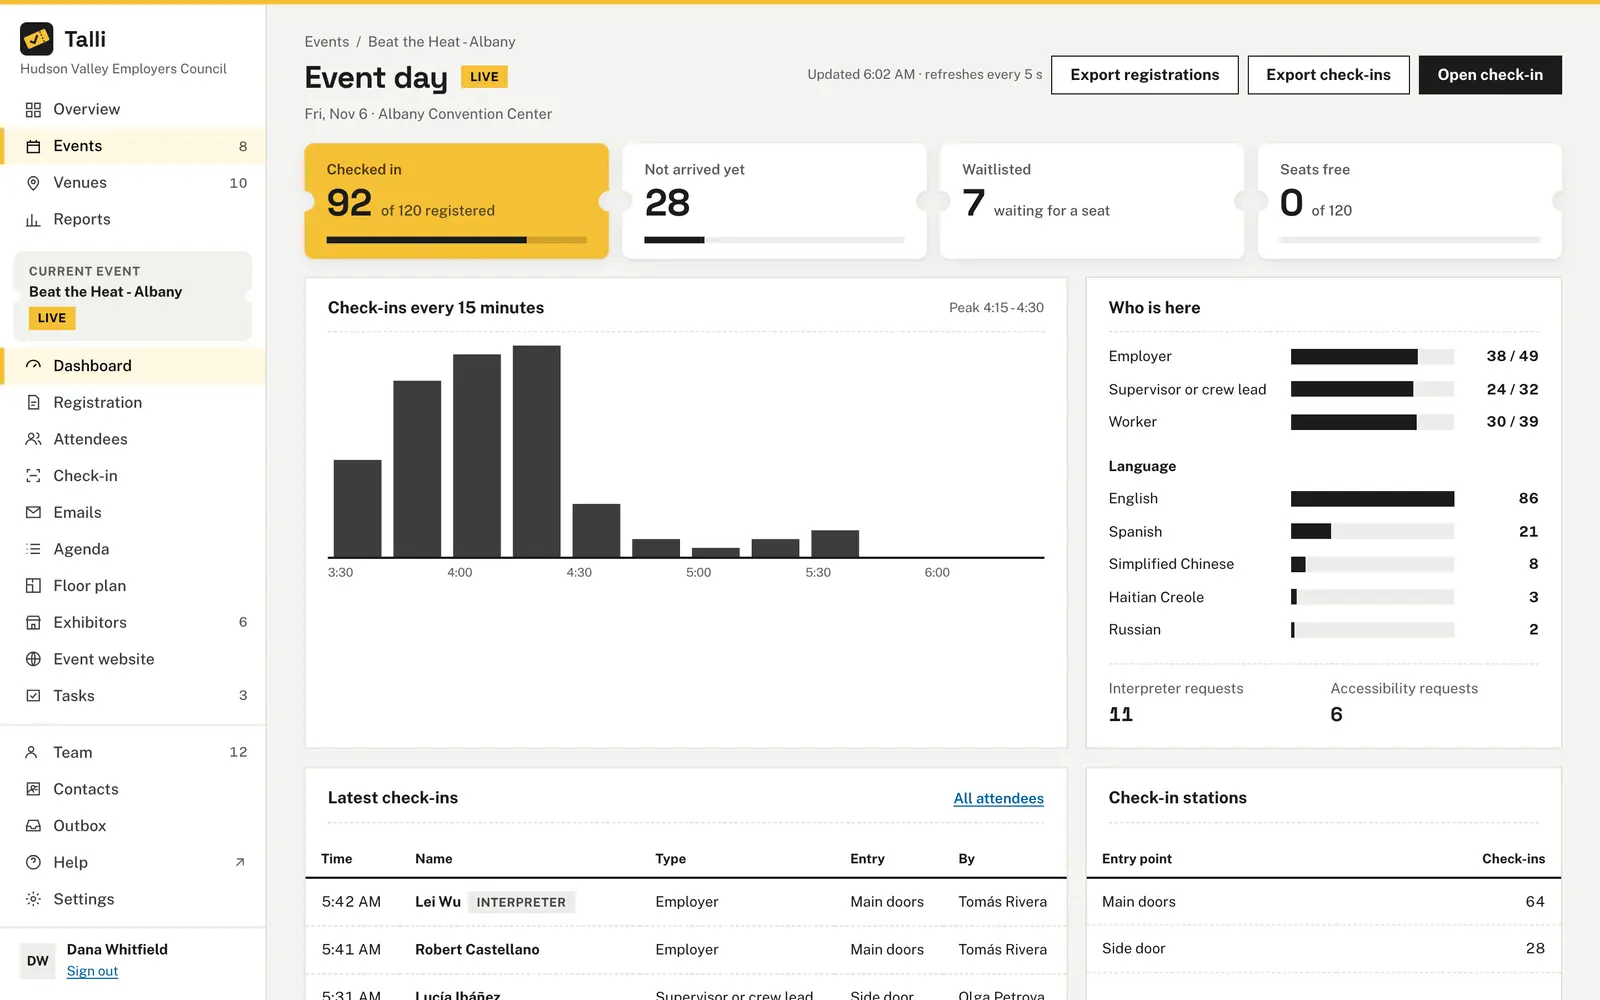
While the event runs, the dashboard refreshes every 5 seconds: checked in, not arrived yet, waitlisted and seats free, check-ins every 15 minutes, who is here by attendee type and language, and the latest arrivals with their entry point.
Exports break in the spreadsheet
Export registrations or check-ins from the event's dashboard. Files open correctly in Excel, Numbers and Google Sheets, including accented and non-Latin names, and cells are protected from running as formulas.
How it works
Three places to look, from one event on the day to every event in a year.
Watch an event live
Open the event and choose Dashboard. While it runs, the page says Event day with a Live badge.
Check the organization
Choose Overview in the menu for live and upcoming events, totals and what needs attention.
Run a report
Choose Reports, set From, To and a Region if you like, choose Apply, then pick a tab.
Export a spreadsheet
On the event's dashboard choose Export registrations or Export check-ins, then confirm in the dialog to download.
Frequently asked questions
Which events do reports count?
Published and closed events that start between the two dates, last day included, and only confirmed registrations. Drafts and cancelled events are left out.
Does an evening event count on the wrong day?
No. Reports use the date in each event's own time zone, so an evening event in New York counts on its own day.
Who can export attendee data?
Owners and admins can export registrations, check-ins and CE credits. Talli always asks first, download links work once for 10 minutes, and every export is recorded in the activity log.
Can staff see the dashboard and reports?
Yes. Everyone in the organization can see the dashboard, the Overview and the reports. Staff do not see the export buttons.
See your events in one place
Watch the dashboard and run the reports on your own events.